Purpose: The purpose of lab 1A is to analyze the effects of selective permeability on diffusion. More specifically, it deals with the passive transportation and osmosis of small solute and water molecules. Another concept covered by the lab is the tendency of molecules to move down their concentration gradients, which is characterized by movement from high to low concentration. We wanted to see what would happen to the concentration of glucose in the dialysis bag and the beaker solution. Would glucose remain concentrated in the dialysis bag or would the beaker test positive for glucose?
Introduction: The highly selective membrane of a cell allows only certain molecules to pass through it. The method used to transport molecules across a membrane depends on the size of the molecules and the concentration of those molecules in the inside and outside of the cell. Molecules that are small enough to fit in protein channels and move from high to low concentrations require no energy. This movement down the concentration gradient is a key element of passive transport. Although water is polar, meaning it can not dissolve easily in the nonpolar interior of the plasma membrane, it's still able to diffuse across selective membranes with the help of aquaporins, specific channel proteins for water that have a hydrophilic tunnel across the membrane. Dialysis tubing is an artificial semi-permeable membrane that is often used in patients with kidney failure. The tubing filters toxin's from a patient's body like a healthy kidney would. This means that small pores are present on the surface of dialysis tubing.
Methods:
 |
| We cut a piece of dialysis tubing and placed it in water.This allowed us to open the tubing. |

To create an artificial selective membrane, we tied one end of the dialysis tubing.


We tested the glucose and starch solution placed in the tubing with glucose Testape.
Our results showed that glucose was extremely concentratated in the solution placed inside the dialysis bag. The brown color that appeared at the end fit the highest concentration label on the Testape bottle.
Next, we tested the distilled water with Lugol for its concentration of glucose . The color that appeared fit with the negative example of the key on the Testape bottle. We can now assume that the distilled water and Lugol solution have no glucose concentration. This solution is located outside of the dialysis tubing.

We placed the dialysis bag with glucose starch solution into the beaker.
For optimal results, we waited 30 minutes.


 |
| Here is a comparison of the before and after glucose results. The graph also demonstrates the change in colors throughout the experiement. |
 |
| Here is a summary of the Testape glucose results. |
Discussion:
The results of our first glucose test reinforced that glucose was present in the dialysis bag but absent in the beaker's solution. After 30 minutes of contact with the distilled water and Lugol, the dialysis bag allowed certain molecules to diffuse despite its selective permeability. The microscopic pores on the surface of the dialysis tube permitted only certain molecules to diffuse across the membrane. The brown color on the Testape of the final beaker solution told us that glucose had successfully diffused out of the dialysis bag, which means that it was small enough to pass through the pores of the dialysis bag. The inside of the bag still tested positive. The prescence of glucose in both solutions proves that molecules want to achieve dynamic equilibrium by moving from high concentration( initially, the inside of the dialysis bag) to lower concentration (initially, the beaker solution). The picture taken after 30 minutes depicts a dialysis bag that has changed into a dark black or purple color. This change is a result of the Lugol(IKI) solution coming into contact with starch. Distilled water and IKI diffused from high concentration to a lower concentration found inside the dialysis bag. The introduction of the lab described that Lugol's function is to test the prescence of starch. The final dialysis bag became dark black because IKI had diffused into the bag;however, the lack of color change in the outside meant that starch was unable to diffuse across the dialysis membrane. The results of this process proves that distilled water and IKI are able to diffuse leave and enter the dialysis bag. Starch was unable to diffuse through the pores of the membrane because it is a very complex carbohydrate. To support diffusion in lab 1A with quatitative data, we could mass the dialysis bag before and after it was placed in the solution. The different molecules moving in and out of the bag would alter tha mass of the bag. Based on our observations, the molecule size from smallest to largest would be water molecules, IKI molecules, glucose molecules, membrane pores, and starch molecules. Water, IKI, and glucose molecules must be smaller than the pores because they were able to diffuse across the membrane. Starch molecules are the largest because they were unable to fit through the dialysis pores. If the experiment began with glucose and IKI inside of the dialysis bag and only starch and water in the beaker, then the IKI and glucose would diffuse out of the bag and into the beaker solution. As a result, the beaker solution would turn black/purple, but the inside wouldn't because the starch would remain only in the beaker solution.
Conclusion: The selective permeability of the dialysis bag allowed glucose,IKI, and water to diffuse across the membrane. As a result, the inside of the beaker became black/dark purple (starch is present) and the outside tested positive for glucose.
References:
Online Campbell Biology Book
Part 1B: Osmosis
Purpose: The purpose of lab 1B was to understand the relationship between solute concentration and osmosis (the movement of water through a selectively permeable membrane). We wanted to see what happened as we increased the molarity of the solution in the bag. Where would water flow? And would the bags gain or lose mass?
Introduction: Osmosis, in simplest terms, is the diffusion of water. Water particles will move from an area of high concentration to an area of low concentration, until both sides of the membrane reach dynamic equilibrium (water will move between two solutions, but there will be no net change in the amount of water in either solution). A solute within a membrane, when placed in distilled water, will rush out of the membrane as water rushes in. The membrane solution is hypertonic to the distilled water, meaning it has a greater concentration of dissolved solute particles and a lesser concentration of water.
Methods:

We cut 6 pieces of dialysis tubing, each of which approximately the same size.

We soaked them in water so it would be easier to open them.


We tied off one end of each bag to prevent leakage.

We filled each bag ⅔ full of the following solutions of glucose: 0M, .2M, .4M, .6M, .8M, 1M. Then we tied the other end of the bag. We massed each bag and put them into their own cup of distilled water. Side note: the cups were ¾ full of water.

We waited patiently for about 2.5 hours… And massed the bags again.
Individual data:
Molarity
|
Initial Mass
|
Final Mass
|
Percent Change in Mass
|
0
|
16.9
|
16.61
|
-1.7
|
.2
|
11.58
|
20.29
|
75
|
.4
|
13.47
|
11.93
|
-11.4
|
.6
|
17.85
|
16.21
|
-9.2
|
.8
|
14.64
|
23.38
|
59.7
|
1
|
18.24
|
25.82
|
41.6
|
Class Data:


Discussion:
A word to the wise: read the directions. Read them slowly. Carefully. Do not skim them and pretend you know what you’re doing. You don’t. Because you’ll end up using iodine instead of distilled water in the cups, and you’ll have to start all over, and you’ll want to hit your head against a wall. It’s a dumb mistake to make, resulting in unneeded stress. You’ll rush trying to finish and you’ll get careless. Your data will be wrong on so many levels because in all likelihood you massed incorrectly. You end up with a 75 percent change when you were supposed to get 4.61. How quickly can you say “human error”?
Our data isn’t relevant for discussion, so forgive me, but I’m going to use the class averages. As the concentration of glucose in the bags went up, the percent change in mass increased as well. They have a direct relationship with one another. The reason we used percent change in mass rather than change in mass is because the initial masses of each bag were not the same, so change in mass wouldn’t point to a trend. The glucose solution has more solute and consequently less water; the water potential is less than the distilled water of the beaker. As a result, the net movement of water went from the beakers to the bag, causing an increase in mass percent change. This is with the exception of the 0M solution, which was isotonic (equal in solute) to the distilled water in the beaker. In a perfect world, the class average should've been 0 percent change, but we must account for the possibility of particles in tap water. Had we used .4M instead of 0M, bags with molarities of less than .4 sucrose would lose mass while those with more would gain mass in order to reach equilibrium.Conclusion: While our group’s data may not answer our question, the class averages can. The higher the molarity, the more solute leaves the bag, the more water goes into the bag, and the larger the mass percent change.
References: Lab One Diffusion and Osmosis background information.
1C
Purpose:
The purpose of this part of the lab was to show how when solute is added to water, the water potential automatically goes down. This specifically deals with the fact that pure water is 0, therefore if any thing I added to it I goes down. Not only were we trying to show the idea of water potential, but also trying to find a good balance between water potential and solute potential.
Introduction:
Water potential is pressure potential plus solute potential. If pressure potential increases then so will water potential. When solute potential increases water potential will decrease. Water will always move from a high water potential to a lower one in order to reach equilibrium. For this reason calculating water potential can help predict where the net movement of water will be. Animal and plant cells react differently to water potential.
Due to the cell wall plant cells are better equipped to handle a high water potential inside the cell than animal cells. While animal cells would burst under high water potential conditions, plant cells would not.
Methods:
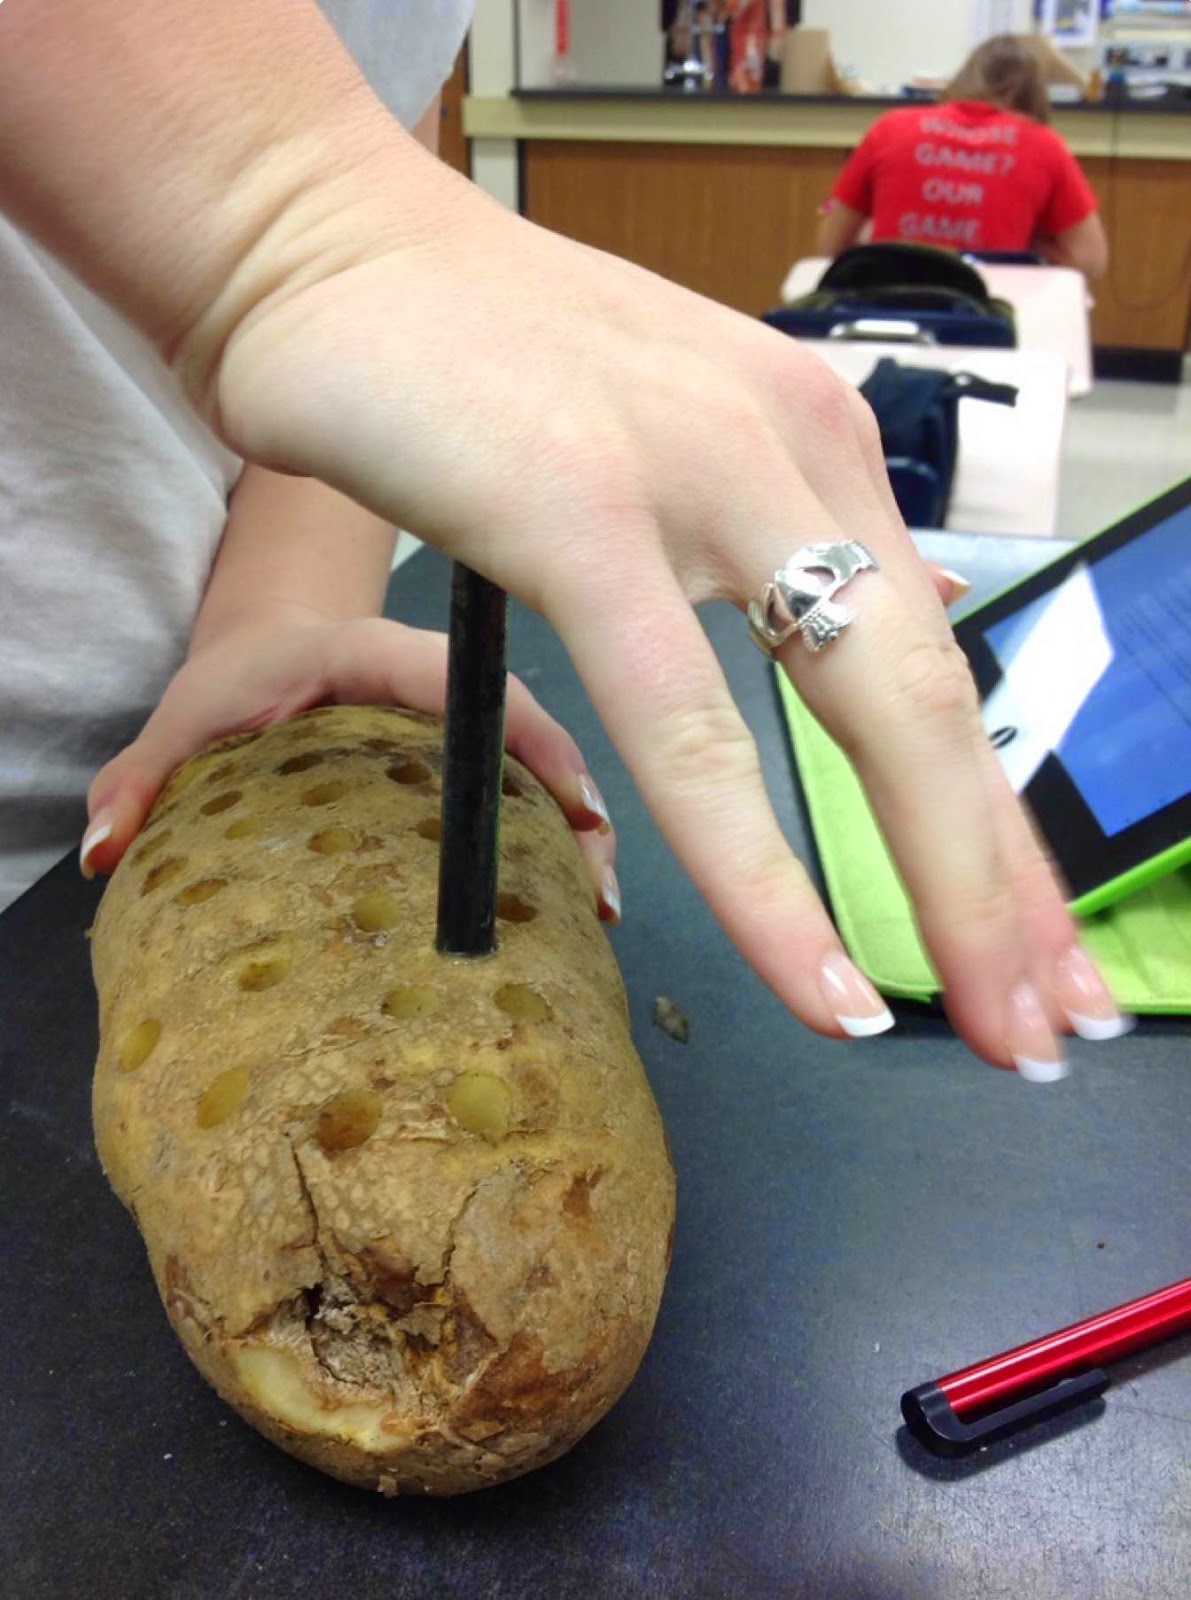 |
| First we had to punch holes in a potato and use the potato tubes we got from that to put in the solutions. |
After we took the slices out, we put them in groups of four and measured them.


In this next step, we put the potato slices into different concentrations of glucose.
This was to test how different concentrations effected water potential. (0.4 M Not Shown)


 After letting the potatoes sit for a day, we looked at them again. We knew something must have happened because the water was a lot cloudier.
 |
| Distilled Water |
 |
| .2M |
 |
| 0.4M |
 |
| 0.6M |
 |
| 0.8M |
 |
| 1.0M |
Data:


Discussion:
Looking at the graph of our groups data and the classes there are similarities, but a few key differences, too. Both lines went down, showing that as the solute concentration went up the water potential went down. This was the main similarity of the two lines. Where the lines varied was in the little details. Such as for the majority of the points, our groups data was lower than the class averages. We had overall smaller potato pieces, so perhaps this effected how much the potato was able to take in. Another large difference about our lab group from the class average was that while the class average's percentages continuously went down as the solute concentration went up, on the last few points our percentage went up. This I believe is due to us accidentally taken wrong weight of the potatoes, or because the potatoes did not soak as long as they should have. One of the major issues that could skew our data is weight calculations. There could have been a few times where we did not read the scale correctly or did not wait long enough for the scale to settle. In the future we need to make sure we triple check our scales. The overall data did support the underlying reasoning to this experiment. The fact that most of the percent changes were negative shows water potential in actions. The potatoes took in the extra solute, balancing the water potential on both the outside of the membrane and the inside.
Looking at the graph of our groups data and the classes there are similarities, but a few key differences, too. Both lines went down, showing that as the solute concentration went up the water potential went down. This was the main similarity of the two lines. Where the lines varied was in the little details. Such as for the majority of the points, our groups data was lower than the class averages. We had overall smaller potato pieces, so perhaps this effected how much the potato was able to take in. Another large difference about our lab group from the class average was that while the class average's percentages continuously went down as the solute concentration went up, on the last few points our percentage went up. This I believe is due to us accidentally taken wrong weight of the potatoes, or because the potatoes did not soak as long as they should have. One of the major issues that could skew our data is weight calculations. There could have been a few times where we did not read the scale correctly or did not wait long enough for the scale to settle. In the future we need to make sure we triple check our scales. The overall data did support the underlying reasoning to this experiment. The fact that most of the percent changes were negative shows water potential in actions. The potatoes took in the extra solute, balancing the water potential on both the outside of the membrane and the inside.
Conclusion:
Our data and the class average data supports the water potential equation. It shows that when there is more solute in a solution the water potential will go down. This makes high water potential areas go to low water potential areas trying to reach equilibrium, which is water happened to the potato.
Our data and the class average data supports the water potential equation. It shows that when there is more solute in a solution the water potential will go down. This makes high water potential areas go to low water potential areas trying to reach equilibrium, which is water happened to the potato.
IE: Plasmolysis
Purpose: The purpose of lab 1E is to observe the changes that onion cells will experience due to the concentration of the solution outside of the onion cells. Conditions needed to achieve plasmolysis and turgid states in plants will be revealed. Also, the role of water potential in these changes will be discussed.
Introduction: Plasmolysis is the shrinking of the cytoplasm and pulling away of the cell membrane from the cell wall. It occurs in response to diffusion of water out of the cell and into a hypertonic solution.
Methods:

Image from: http://www.microbehunter.com/observing-plasmolysis/
The epidermis of the onion is retrieved.

The onion was observed at 100x magnification.

15 % NaCl(salt) was added to the onion and observed. Then, the onion epidermis was flooded with distilled water and observed. The picture above shows the original onion epidermis(top) and the onion epidermis flooded in NaCl(bottom).
Discussion:
This lab shows the actual depiction of the cell membrane in a plant cell pulling away from the cell wall by plasmolysis. Looking trough a microscope the observer sees the membrane pull away, making the inside of the cell deformed while the cell wall still maintains its shape. By adding salt water to these cells, the cells become dehydrated and that is when plasmolysis occurs. While we did not do this lab ourselves, I can imagine the results and data would be along the lines of the majority of the cells under the microscope undergoing plasmolysis as one point. This also makes the purpose of the lab evident. It show how if a plant cell is in a low water potential environment, plasmolysis will occur.
Conclusion: Hypertonic solutions leech water from plant cells, causing the cytoplasm to shrink and the cell membrane to pull away from the cell wall. Solute goes into the cells as water goes out. This happens because water potential is higher inside the cells, so water moves out of the cells to reach equilibrium.